Cash-on-Cash Return Calculator: The #1 Metric for Rental Investors
Rental investors love debating metrics. Cap rate. Gross rent multiplier. Net yield. IRR. Each one has its advocates, and each one measures something real.
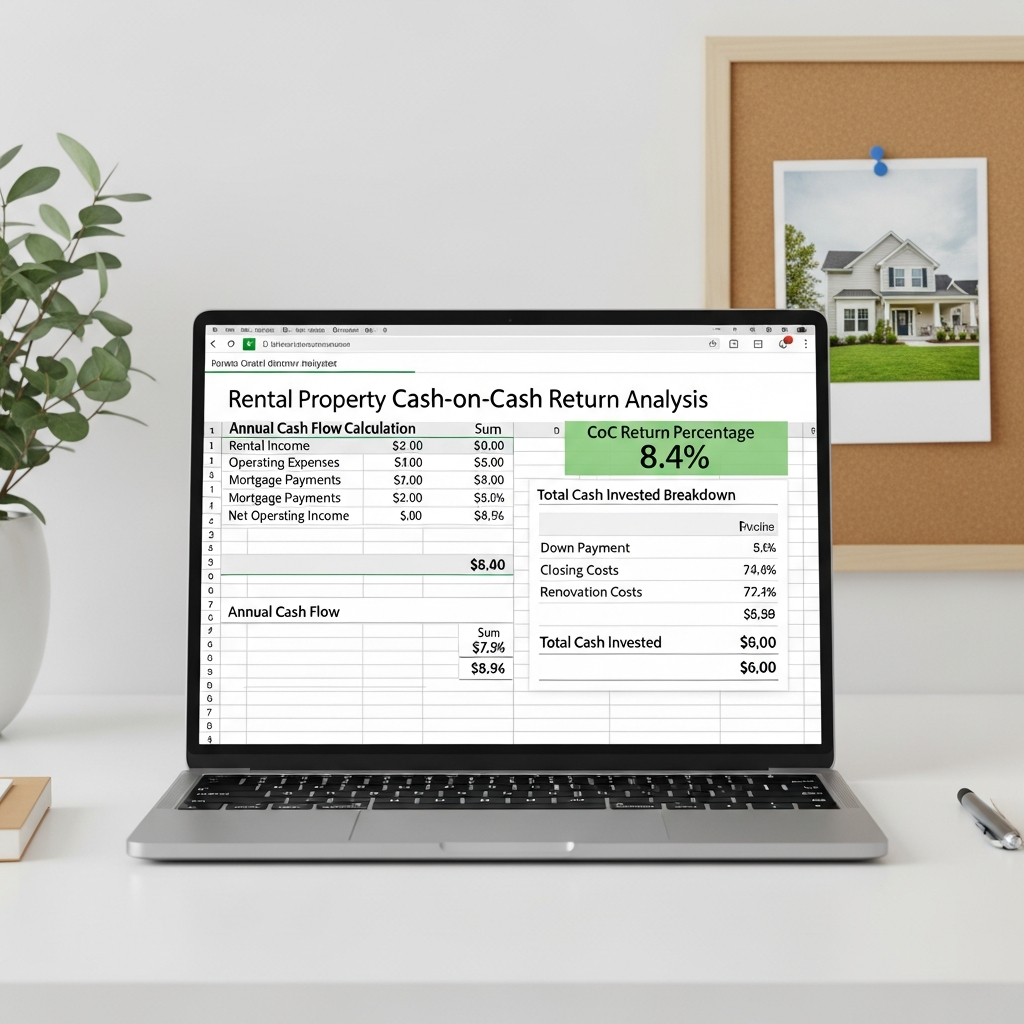
But when a rental investor asks the most fundamental question, "How hard is my money actually working?", there is only one metric that answers it directly: cash-on-cash return.
Cash-on-cash return tells you what percentage of the actual cash you invested is coming back to you each year as cash flow. Not the property's value. Not accounting profit. Cash. The kind you can spend.
This guide will show you how to calculate it, what numbers to include and exclude, and how to build a calculator in Excel that gives you a defensible CoC figure for any rental property.
What Cash-on-Cash Return Actually Measures
Cash-on-cash return (CoC) is a single ratio:
Annual Pre-Tax Cash Flow / Total Cash Invested = Cash-on-Cash Return
That is it. No depreciation. No appreciation assumptions. No tax benefits. Just the cash you put in versus the cash you get back each year.
This simplicity is not a limitation. It is the point. CoC strips away the financing-dependent metrics and the speculative return components to answer a question that is always relevant: if I write a check for this amount today, how much cash will it produce per year?
A property generating $8,400 per year in net cash flow on $105,000 invested delivers 8% cash-on-cash return. That is the answer. You can compare it to a savings account, another property, or any other use of that $105,000.
The Complete Cash Invested Calculation
Where investors most commonly miscalculate CoC is in the denominator. They count the down payment and forget everything else. Cash invested is the total out-of-pocket cash required to acquire the property and make it rent-ready.
Here is what belongs in the denominator:
Acquisition Costs
- Down payment
- Closing costs (lender fees, title, escrow, recording, prepaid interest)
- Inspection fees
- Appraisal fee
- Any points paid to buy down the rate
Renovation and Setup Costs
- Repairs required before leasing
- Cosmetic upgrades to justify market rent
- Appliances if not included
- First unit turnover costs if acquiring an occupied property
Reserves (if funding them upfront)
- Some investors pre-fund a capital reserve account at acquisition. If you do, include it. If you build reserves from cash flow, exclude it.
On a $300,000 single-family rental with 25% down, a realistic total cash investment might look like this:
| Item | Amount |
|---|---|
| Down payment | $75,000 |
| Closing costs | $4,200 |
| Initial repairs | $6,500 |
| Appliances | $1,800 |
| Pre-funded reserves | $3,000 |
| Total Cash Invested | $90,500 |
Using only the down payment ($75,000) would inflate your CoC by 17% before you even collect rent. This is why comparing CoC numbers across different investors is meaningless unless you know how each one defines cash invested.
The Annual Pre-Tax Cash Flow Calculation
The numerator requires the same rigor. Annual pre-tax cash flow is not gross rent. It is what is left after every operating expense and debt service payment.
Annual Cash Flow = Gross Rental Income - Operating Expenses - Annual Debt Service
Start with gross scheduled rent, then subtract:
Vacancy and credit loss: In most markets, budget 5-8% of gross rent. A property that rents for $2,200/month has $26,400 in gross annual rent, but vacancy and occasional non-payment realistically reduces effective gross income to $24,400-$25,000.
Operating expenses: Property taxes, insurance, property management (typically 8-10% of collected rent), maintenance and repairs, HOA fees if applicable, landscaping, and pest control. Experienced landlords budget 35-50% of effective gross income for operating expenses on single-family homes, more for older properties.
Debt service: Your actual monthly mortgage payment multiplied by 12. Use principal and interest only. Taxes and insurance are already counted above.
Here is a realistic annual cash flow calculation for that $300,000 property:
| Item | Annual Amount |
|---|---|
| Gross scheduled rent | $26,400 |
| Vacancy (6%) | -$1,584 |
| Effective gross income | $24,816 |
| Property taxes | -$3,600 |
| Insurance | -$1,400 |
| Property management (9%) | -$2,234 |
| Maintenance reserve | -$1,800 |
| Total operating expenses | -$9,034 |
| Net operating income (NOI) | $15,782 |
| Annual debt service ($225k, 7%, 30yr) | -$17,964 |
| Annual pre-tax cash flow | -$2,182 |
That property generates negative cash flow. The CoC return is negative. Some investors would still buy it for appreciation potential, tax benefits, or long-term equity buildup, but the CoC calculation is doing exactly its job: it is showing you that you are subsidizing this property, not the other way around.
Building the Calculator in Excel
Open a new workbook with two sheets: Inputs and Results.
Sheet 1: Inputs
Set up your input section with these labeled rows (highlight input cells in yellow):
Property Information
- B2: Purchase Price
- B3: Down Payment Percentage
- B4: Down Payment Amount (formula: =B2*B3)
- B5: Loan Amount (formula: =B2-B4)
- B6: Interest Rate
- B7: Loan Term (years)
- B8: Monthly Mortgage Payment (formula: =PMT(B6/12,B7*12,-B5))
Acquisition Costs
- B10: Closing Costs
- B11: Initial Repairs
- B12: Other Setup Costs
- B13: Pre-funded Reserves
Total Cash Invested: formula =B4+B10+B11+B12+B13
Income
- B16: Monthly Gross Rent
- B17: Vacancy Rate
- B18: Effective Monthly Income (formula: =B16*(1-B17))
Operating Expenses (Monthly)
- B20: Property Taxes (Annual divided by 12)
- B21: Insurance (Annual divided by 12)
- B22: Property Management (formula: =B18 multiplied by management rate)
- B23: Maintenance Reserve
- B24: HOA Fees
- B25: Other Monthly Expenses
Key Calculated Values
- B27: Monthly NOI (formula: =B18-SUM(B20:B25))
- B28: Annual NOI (formula: =B27*12)
- B29: Annual Debt Service (formula: =B8*12)
- B30: Annual Cash Flow (formula: =B28-B29)
Sheet 2: Results
Your results sheet displays the key metrics clearly:
| Metric | Formula | Your Value |
|---|---|---|
| Total Cash Invested | =Inputs!B13_total | |
| Annual Cash Flow | =Inputs!B30 | |
| Cash-on-Cash Return | =Annual Cash Flow / Total Cash Invested | |
| Cap Rate | =Annual NOI / Purchase Price | |
| Gross Rent Multiplier | =Purchase Price / Annual Gross Rent | |
| Monthly Cash Flow | =Annual Cash Flow / 12 | |
| Break-Even Occupancy | =Annual Expenses / Annual Gross Rent |
The CoC formula in Excel: =Annual_Cash_Flow/Total_Cash_Invested
Format the result as a percentage with one decimal place. Add conditional formatting: green if the result is above your target (typically 6-8%), yellow for marginal (4-6%), red for below 4%.
Two Mistakes That Make Your CoC Look Artificially High
Mistake 1: Using List Rent Instead of Market Rent
Do not use the seller's quoted rent or the MLS listing rent as your income figure. Research comparable active rentals yourself. Landlords who overprice their listings get vacancy. Sellers managing poorly maintained units often list below market to retain tenants. Use realistic market rent for a properly maintained unit of this type and location.
Mistake 2: Using Today's Expenses for a Future Renovation
If you are buying a property that needs work, do not calculate CoC using pre-renovation rent and post-renovation expenses. Either model the as-is scenario or the stabilized-post-renovation scenario. Mixing timelines produces a number that corresponds to no real situation.
Cash-on-Cash vs. Cap Rate: When to Use Each
These two metrics are frequently confused. They measure different things and serve different purposes.
Cap rate is a property metric. It divides NOI by property value. Cap rate does not depend on your financing at all. Two investors buying the same property with different down payments will have different CoC returns but the same cap rate. Cap rate is useful for comparing properties independent of financing, benchmarking against market cap rates, and quick-screening deals before running full numbers.
Cash-on-cash return is an investor metric. It depends entirely on how much cash you put in and how you financed the deal. A strong property in a low-cap-rate market can still deliver excellent CoC if you use leverage effectively. A high-cap-rate property can generate poor CoC if local financing rates are high or you paid significant closing costs.
Use cap rate to evaluate the property. Use cash-on-cash to evaluate the deal as structured for your specific financing.
Using CoC to Compare Multiple Properties
The real power of cash-on-cash return is comparison. When you are evaluating multiple deals simultaneously, CoC lets you compare them on a single number that accounts for purchase price, financing, operating expenses, and cash investment simultaneously.
Build a comparison tab in your Excel workbook. List each property as a row. Columns should include purchase price, total cash invested, annual NOI, annual cash flow, cap rate, and CoC return. Sort by CoC return descending.
This comparison will often reveal that the property with the highest purchase price delivers the best CoC return, because cap rates in that submarket support higher rents relative to prices. Or it will reveal that a lower-quality property in a weaker market looks better on cap rate but worse on CoC because financing costs eat the spread.
Neither outcome is automatically right or wrong. But having both metrics side by side forces you to understand exactly why one deal is better than another, rather than guessing based on gut feel.
The Target That Actually Matters
What is a good cash-on-cash return? The honest answer: it depends on your alternatives and your strategy.
In 2021, with 3% mortgage rates, 8-12% CoC returns were achievable in most markets with moderate leverage. In 2025-2026, with rates at 7-8%, the same properties in the same markets often generate 3-5% CoC on conventional financing.
The benchmark that matters is your personal hurdle rate: what return would cause you to keep the cash instead of deploying it? If you can earn 5.2% in a money market account with zero work and zero risk, a rental property delivering 5.5% CoC is not a compelling deal. It needs to clear your hurdle rate by enough to compensate for the illiquidity, management burden, and maintenance risk.
Most experienced rental investors set a minimum CoC target of 6-8% in today's rate environment. Deals that do not clear that threshold get passed unless there is a compelling appreciation story with specific, defensible assumptions behind it.
The cash-on-cash return calculator does not make that decision for you. It gives you the honest number. What you do with it is the investment.
Related template
Rental Property Analyzer
Analyze any rental deal in 15 minutes — not 3 hours in a messy spreadsheet. Cash flow, cap rate, cash-on-cash return, and 10-year projections. All automated.
Get the Template — $49