Mobile Home Park Underwriting Spreadsheet: Lot Rents, Infill, and RUBS in Excel
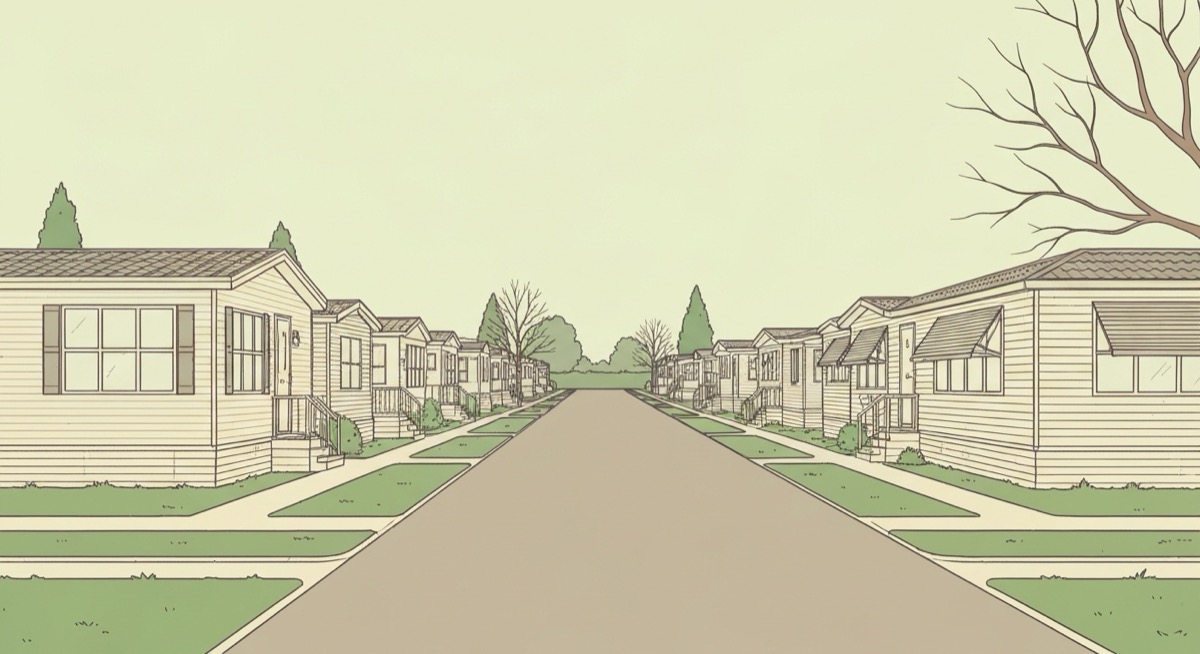
A Texas investor sent us a broker pro forma last March. The package looked clean: 80-pad mobile home park, $2.4M asking price, 9.2% pro forma cap rate, "value-add through infill and utility billing." He almost wired the earnest money. Then he ran the numbers in his own underwriting spreadsheet and discovered the seller was reporting economic occupancy at 95% while physical occupancy was 76%. The pro forma assumed 20 vacant lots would fill in year one. The actual cost to bring those lots online was buried in a CapEx footnote at $4,800 per pad. The deal worked at $1.7M, not $2.4M.
This is what a real mobile home park underwriting spreadsheet does. It strips away the broker narrative and forces the asset to defend its price using lot rents, infill costs, and utility recovery math. If your model just multiplies trailing NOI by a cap rate, you are not underwriting, you are accepting the seller's pricing.
This article shows the structure of an MHP underwriting model that handles the three things that separate winners from losers in this asset class: the lot rent versus park-owned home revenue split, infill optionality, and RUBS (Ratio Utility Billing System) implementation. Real numbers, real Excel formulas, real decisions.
Why Apartment Underwriting Models Fail on Mobile Home Parks
Most investors come to MHP from single-family rentals or small multifamily. They open a copy of their multifamily underwriting spreadsheet, swap "units" for "pads," and call it a day. This is how you overpay.
Apartments and mobile home parks generate revenue differently. In a 24-unit apartment, every unit produces gross rent that includes the building, the appliances, the HVAC, and the land. In an 80-pad MHP, you might have 60 lot rents at $325 (where the tenant owns the home) and 20 park-owned home rents at $850 (where you own a depreciating asset that needs roofs, plumbing, and tenant turnover capital).
Lot rent is the goose. Park-owned home rent is the egg, and the egg has eyebrow shingles that fall off every seven years. Underwriting them at the same multiple is wrong.
Three Numbers That Drive MHP Value
- Lot rent per pad: The recurring revenue from tenant-owned homes. Trades at high multiples because operating costs are minimal (you do not maintain the home, the tenant does).
- POH (park-owned home) revenue: Bundled rent that includes the home itself. Trades at lower multiples because you are essentially running a Class C apartment portfolio with declining collateral.
- Infill optionality value: The discounted cash flow from vacant lots that can be filled. This is where 30 to 60 percent of value-add MHP returns come from, and it is the line item brokers misuse most.
Building the Lot Rent Block in Excel
Start with the rent roll. Not the seller's pro forma rent roll, the actual T-12 (trailing twelve months) deposit history you got in due diligence. The model needs three sections: stabilized lot rent, POH rent, and other income (storage, application fees, late fees, RV pads).
Set up your inputs in column B starting at row 4:
| Cell | Input | Example Value |
|---|---|---|
| B4 | Total pads | 80 |
| B5 | Tenant-owned occupied pads | 52 |
| B6 | Park-owned occupied homes | 8 |
| B7 | Vacant pads (no home) | 15 |
| B8 | Vacant POH (home, no tenant) | 5 |
| B9 | Average lot rent (TOH) | $325 |
| B10 | Average POH rent | $850 |
| B11 | Lot rent embedded in POH rent | $325 |
Now compute monthly gross potential income, splitting it cleanly between lot revenue and home revenue. The split matters for valuation later.
Lot revenue (Cell B13):
=(B5+B6)B9+B8B9
This counts lot rent from tenant-owned occupied pads, lot rent embedded in occupied POH (always count it as lot revenue, not home revenue), and lot rent from vacant POH (still your land asset, just not currently producing). Vacant pads with no home contribute zero until infilled.
Home revenue (Cell B14):
=B6*(B10-B11)
This is the premium over lot rent that the home itself generates. For 8 occupied POH at $850 with $325 embedded lot rent, that is 8 x $525 = $4,200 per month of home revenue.
Physical occupancy (Cell B15):
=(B5+B6)/B4
For our example, 60/80 = 75%. Brokers will quote you economic occupancy at 95% by including delinquent tenants and aspirational rents. Always compute physical first.
Modeling Infill the Right Way
Infill is bringing a vacant pad online by either moving in a home or selling a home in place. Brokers love to underwrite stabilized infill at 100% in year one. Real infill takes 18 to 36 months and costs real cash. If your model does not separate stabilized NOI from infill upside, you are paying for value-add that may never materialize.
Infill Cost Structure
Per vacant pad, here is what brings it online in 2026 markets:
| Infill Cost Item | Low Range | High Range |
|---|---|---|
| Pad prep (concrete, anchors, skirting) | $2,500 | $4,500 |
| Utility hookup (water, sewer, electric) | $1,800 | $5,000 |
| Used home acquisition (singlewide, livable) | $8,000 | $22,000 |
| Transport and set | $3,500 | $7,500 |
| Marketing and tenant placement | $500 | $1,500 |
| Total per infilled pad | $16,300 | $40,500 |
If you are selling the home rather than renting it (the right move in most markets, because POH inventory is a maintenance trap), you recover $15,000 to $35,000 of that capital over 24 to 60 months through home note payments. Build a separate infill schedule that tracks deployed capital, recovered capital, and stabilized lot rent month by month.
Infill NPV (Cell F25):
=NPV(B30,F5:F28)-F4
Where B30 is your discount rate (12% is a fair starting point for MHP value-add), F4 is the upfront capital deployed, and F5:F28 are the 24 monthly cash flows from lot rent, home note, and recovered tenant turnover.
Run a sensitivity flag on infill velocity: =IF(F25/F4<0.20,"INFILL DOES NOT JUSTIFY PRICE","OK"). If the infill IRR cannot clear 20% in your model, you are paying for the seller's pro forma, not the asset's actual upside.
RUBS Implementation: The Most Misunderstood Line Item
RUBS (Ratio Utility Billing System) is how you stop paying tenant water bills. Most parks built before 2000 are master-metered for water and sewer, meaning the park pays one bill and tenants use water like it is free. A 60-occupied pad park typically pays $1,800 to $3,200 per month in water and sewer that should be the tenants' problem.
Implementing RUBS does two things: it recovers utility costs and it changes tenant behavior. Water consumption typically drops 20 to 30% in the first six months after billing starts because nobody fixes their leaking toilet when they are not paying for it.
The Math on RUBS
Set up the RUBS block at row 40:
- B40: Current monthly water and sewer expense ($2,400)
- B41: Occupied pads to bill (60)
- B42: Per-pad allocation method (formula or sub-meter)
- B43: Recovery rate after billing (assume 75 to 85%)
- B44: Implementation cost (sub-meters, billing software, legal review)
Annual recovered utility income (B46):
=B4012B43
At $2,400 monthly water expense and 80% recovery, that is $23,040 per year of new income with no rent increase required.
RUBS payback period (B47):
=B44/(B46/12)
At $18,000 implementation cost and $1,920 monthly recovery, payback is 9.4 months. Anything under 18 months is a clean win.
Value uplift at exit (B48):
=B46/B49
Where B49 is your exit cap rate. At a 7.5% exit cap, $23,040 of new NOI creates $307,200 of asset value from a $18,000 investment.
Why Brokers Already Took This Number
If the seller's pro forma already includes RUBS recovery, you cannot pay for it. The whole point of underwriting RUBS yourself is to capture it as upside, not to validate the broker's price. Always run two scenarios: pre-RUBS NOI for current valuation, post-RUBS NOI for exit valuation. The spread is your value-add.
The Cap Rate Stack: How to Price the Deal
Apartments use one cap rate for the whole asset. MHPs need a stack because lot rent and POH revenue trade at different multiples.
| Revenue Component | Typical Cap Rate (2026) | Why |
|---|---|---|
| Stabilized lot rent (TOH only) | 6.5% to 8.0% | Recurring, low operating cost, sticky tenants |
| POH rent (home portion only) | 11% to 14% | Maintenance, depreciation, turnover risk |
| RUBS recovery | 7.0% to 8.5% | Recurring once implemented |
| Infill upside | Discounted at 15% to 20% IRR | Execution risk, time risk |
Your blended valuation formula sits at the bottom of the model:
Asset value (B60):
=B1312/B61+B1412/B62+B46/B63+F25
Where B61, B62, B63 are the cap rates for lot rent, POH home revenue, and RUBS, and F25 is the infill NPV from earlier.
For our 80-pad example: $325 lot rent x 60 occupied x 12 months / 7.0% = $3,343,000 from lot rent. Plus $4,200 monthly POH premium x 12 / 12% = $420,000. Plus $23,040 RUBS / 7.5% = $307,000. Plus $180,000 infill NPV. Total fair value: $4.25M before assumed financing terms.
If the asking price is $4.6M, you are 8% over. If the asking price is $5.5M, the seller is asking you to pay for stabilized infill that has not happened yet. Walk away.
The MHP Underwriting Checklist
Before you wire earnest money, your spreadsheet should answer all of these:
- What is physical occupancy (not economic)?
- What is the split between TOH lot rent and POH bundled rent?
- How many vacant pads are truly infillable (utilities present, zoning compatible)?
- What is the all-in cost per infilled pad and the IRR on infill capital?
- Does the seller already bill RUBS? If yes, that upside is gone. If no, what is the implementation cost and payback?
- Are there any park-owned homes older than 1976? (Pre-HUD homes cannot be financed and depreciate fast.)
- What is the deferred maintenance on roads, water lines, and septic? Get a full inspection before closing.
- Does the loan you are quoting (agency or community bank) require minimum POH percentage limits? Many agency lenders cap POH at 25% of total pads.
From Broker Pro Forma to Real Decision
The Texas investor we mentioned at the start did not buy at $2.4M. He countered at $1.85M with a 90-day inspection period. The seller refused. Six months later the same park was on the market at $1.95M and the investor passed because the regional bank had tightened lending standards on parks under 100 pads.
That is the right outcome. A real underwriting spreadsheet protects you from buying badly priced assets. The lazy investor would have closed at $2.4M, fought infill cost overruns for two years, and exited at break-even. The disciplined investor moved on and put capital into the next deal where the math worked.
If you want a pre-built model that handles lot rent stacks, POH separation, infill cash flow timing, and RUBS recovery valuation in a single connected workbook, the SheetCraft Flip and BRRRR Calculator ships with an MHP variant that includes the formulas in this article and the full cap rate stack model. Built for investors who underwrite rather than accept pro formas.
Related template
BRRRR Deal Calculator
Model the full Buy-Rehab-Rent-Refinance-Repeat cycle. See exactly how much capital comes back at refinance — before you commit a dollar.
Get the Template — $49