Build a Rehab Cost Estimator Spreadsheet That Knows How Wrong It Is
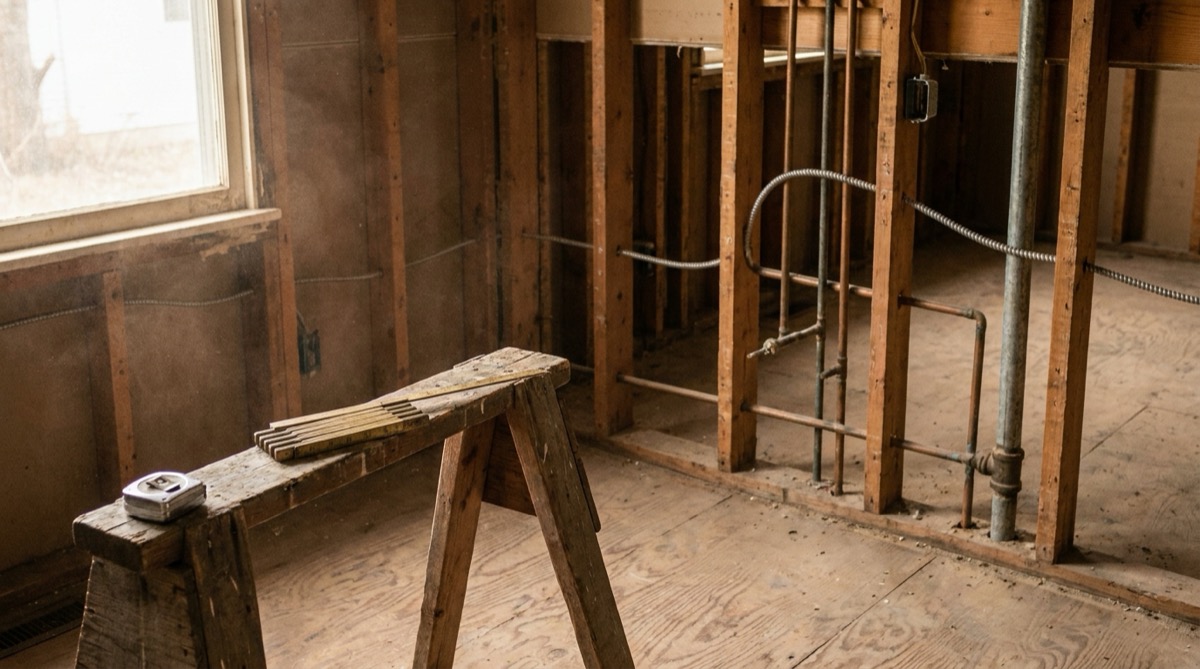
A rehab cost estimator spreadsheet almost always produces one number, and that number is then treated as a fact for the rest of the deal. It goes into the offer. It goes into the lender's package. It goes into the profit projection you show your partner. The problem is that the number came out of a forty minute walkthrough of a house whose walls you were not allowed to open, and nothing on the sheet records that.
Here is what the omission costs. ATTOM's Q1 2026 U.S. Home Flipping Report puts the typical gross flipping profit at $66,000, a 25.4 percent gross return, across 64,348 flipped homes, with a median 165 days from purchase to resale. Gross profit there is only the difference between what the flipper paid and what the flipper sold for. ATTOM says so plainly, and then adds that rehab costs and other expenses "typically run between 20 percent and 33 percent of the property's after-repair value." Put those two sentences side by side. The entire spread you are competing for is $66,000, and the single largest claim against it is the line you estimated from a clipboard in under an hour.
The Deal That Said Yes by $72
Take a real shape of deal. A 1,440 square foot three bedroom, two bath house on Cedar Street. After repair value of $325,000, supported by three closed comps within six blocks. Purchase price $168,000. The walkthrough rehab estimate came to $72,400.
Run that against everything the deal has to pay before profit, and the maximum rehab the deal can absorb is $72,472. The estimate clears it by $72.
Seventy two dollars. That is the entire margin of safety, and it is being carried by a number produced by eyeballing a panel cover that was never removed. Most flippers in that position sign, because the sheet said yes. The sheet did say yes. The sheet simply had no way to say how loudly.
Construction Grades Estimates by How Much You Actually Know
Commercial construction solved this problem decades ago and published the answer. AACE International Recommended Practice 56R-08, the cost estimate classification system for the building and general construction industries, revised August 7, 2020, sorts every estimate into one of five classes. The sorting variable is not care, effort, or experience. It is the maturity of project definition, expressed as the percentage of the scope that is actually defined. Each class carries a published accuracy range at an 80 percent confidence interval.
| Class | Project definition | What a flipper has at that point | Low side | High side |
|---|---|---|---|---|
| Class 5 | 0% to 2% | Drive-by or one walkthrough, square foot factoring | -20% to -30% | +30% to +50% |
| Class 4 | 1% to 15% | Rough room by room scope, allowances assigned | -10% to -20% | +20% to +30% |
| Class 3 | 10% to 40% | Written scope, measured takeoff, allowances priced | -5% to -15% | +10% to +20% |
| Class 2 | 30% to 75% | Contractor bids received against your scope | -5% to -10% | +5% to +15% |
| Class 1 | 65% to 100% | Signed subcontracts, materials ordered | -3% to -5% | +3% to +10% |
Read the Class 5 row again, because that is the row your purchase contract is signed on. A walkthrough estimate is accurate to somewhere between plus 30 and plus 50 percent on the high side. Not because you are careless. Because 98 percent of the scope is still undefined when you write the number down.
Applied to Cedar Street, a Class 5 estimate of $72,400 has an upper bound somewhere between $94,120 and $108,600. Against a ceiling of $72,472. The standard is telling you, before you have opened a single wall, that this deal has a serious chance of being dead. Your spreadsheet, meanwhile, is showing a green cell.
Give Every Line Its Own Class, Not the Sheet One Contingency
The fix is not a bigger contingency at the bottom. It is a class column on every line, because a real rehab estimate is a mix of classes. The roof already has a written bid. The plumbing is a guess behind plaster. Those two lines do not deserve the same error bar, and averaging them into one blanket percentage destroys the only information you have.
Lay the sheet out with the class table parked somewhere out of the way, say $M$3:$O$7, holding class number, low percentage and high percentage. Then the estimate lines start in row 5:
- Column A: line item
- Column B: basis, meaning what you actually looked at
- Column C: quantity and unit
- Column D: base cost
- Column E: class, 1 through 5
- Column F:
=VLOOKUP($E5,$M$3:$O$7,2,FALSE)pulls the low percentage - Column G:
=VLOOKUP($E5,$M$3:$O$7,3,FALSE)pulls the high percentage - Column H:
=D5*(1+F5)is the low dollar - Column I:
=D5*(1+G5)is the high dollar - Column J:
=I5-D5is the exposure on that line, which you will need in a moment
The class column is the whole design. It converts a soft judgment you were already making, "I am pretty sure about the roof and not at all sure about the plumbing," into a number the sheet can add up. Use the outer end of each AACE band, not the inner end, until you have a personal history of actuals that says otherwise.
| Line | Basis | Class | Base | Low | High |
|---|---|---|---|---|---|
| Roof tear-off, 22 squares | Written bid | 2 | $13,200 | $11,880 | $15,180 |
| HVAC, 3 ton replacement | Written quote | 2 | $8,900 | $8,010 | $10,235 |
| Kitchen, full gut, stock cabinets | Takeoff plus allowance | 3 | $16,500 | $14,025 | $19,800 |
| Two bathrooms, full | Allowance per bath | 3 | $11,000 | $9,350 | $13,200 |
| LVP flooring, 1,440 sf at $5.00 | Square foot factoring | 4 | $7,200 | $5,760 | $9,360 |
| Paint, interior and exterior | Square foot factoring | 4 | $6,840 | $5,472 | $8,892 |
| Electrical, panel and partial rewire | Walkthrough only | 5 | $5,200 | $3,640 | $7,800 |
| Plumbing, supply behind plaster | Walkthrough only | 5 | $3,560 | $2,492 | $5,340 |
| Total | $72,400 | $60,629 | $89,807 |
Two lines out of eight are Class 5, and they carry only $8,760 of base cost, 12 percent of the estimate. They generate $4,380 of high side exposure, 25 percent of the total. That is the argument for per-line classes in one sentence: the risk does not sit where the money sits.
Permits and municipal fees deserve their own line and usually their own class, because they are knowable in advance and almost nobody looks them up. If you want the pattern for pricing and sequencing them, see the house flip permit cost and timeline tracker.
Roll Up Two High Numbers, Because Rehab Misses Travel Together
Now you have eight high numbers and you need one. There are two defensible ways to combine them, and the difference between them is worth $11,064 on this deal.
If the lines miss independently, errors partly cancel, and the correct roll-up is the root sum of squares of the line exposures in column J: =$D$14+SQRT(SUMSQ(J5:J12)). That gives $78,743.
If the lines miss together, nothing cancels and you simply add them: =SUM(I5:I12), which gives $89,807.
On a rehab, they miss together. One general contractor prices most of the job, one local labor market sets the rates, one set of walls hides the surprises, and one schedule slip pushes every trade. The independence assumption is the one that gets flippers hurt, because it feels sophisticated and it is quietly optimistic by eleven thousand dollars. Use the straight sum for the go or no-go decision. Keep the root sum of squares visible as the floor of the bad case, not as the expectation.
| Roll-up | Excel | Rehab number | Ceiling at that rehab | Gap |
|---|---|---|---|---|
| Base estimate | =SUM(D5:D12) | $72,400 | $72,472 | +$72 |
| High, independent | =SQRT(SUMSQ(J5:J12)) | $78,743 | $72,307 | -$6,436 |
| High, correlated | =SUM(I5:I12) | $89,807 | $72,019 | -$17,788 |
The ceiling moves between rows because you finance the rehab, so a bigger rehab costs more interest and the deal can absorb slightly less of it. That feedback is small here, the ceiling slides from $72,472 down to $72,019 as the rehab goes from base to correlated high, but the sign is right and it belongs in the model rather than assumed away.
The Ceiling Is the Only Number Your Estimate Has to Beat
Everything above is useless without the thing it gets compared to. The maximum allowable rehab is what is left of the ARV after every other obligation the deal creates, including the profit you refuse to work below. Build it as a subtraction stack on the same sheet.
| Line | Basis | Amount |
|---|---|---|
| After repair value | Three closed comps | $325,000 |
| Purchase price | Contract | ($168,000) |
| Buy side closing | 2.0% of purchase | ($3,360) |
| Sell side costs | 6.5% of ARV | ($21,125) |
| Holding, 165 days | Interest, points, carry | ($15,043) |
| Required profit | Your floor, not a hope | ($45,000) |
| Maximum allowable rehab | $72,472 |
The holding line is the one people wave at. It is $9,742 of interest on an average outstanding balance of $187,400 at 11.5 percent for 165 days, plus $3,024 for two points on the purchase advance, plus $2,277 of taxes, insurance and utilities at $13.80 a day. The interest formula has to model the rehab drawing down over time rather than funding on day one, which is roughly half the rehab balance outstanding on average: =(0.9*$B$3+0.5*$D$14)*$B$8*$B$9/365, where B3 is purchase price, D14 is the rehab total, B8 is the annual rate and B9 is days held. Rate shopping moves this line hard, and the hard money lender comparison spreadsheet is the right place to pin down which lender's number belongs in B8.
Sell side costs at 6.5 percent are commission plus title, transfer and the small concessions that show up at the closing table. If you want that half of the stack built properly rather than assumed at a round percentage, the house flip closing cost estimator prices both settlement statements off a sale price you have not achieved yet.
With the ceiling in a cell, the decision rule is one formula, and it reads the high number rather than the base:
=IF($D$16>$B$20,"KILL",IF($D$14>$B$20,"RENEGOTIATE","PROCEED"))
D16 is the correlated high, D14 is the base, B20 is the maximum allowable rehab. On Cedar Street that formula returns KILL on the day of the walkthrough, while the base estimate is still showing a $72 surplus. One cross check is worth adding beside it: rehab as a share of ARV, =$D$14/$B$2, which is 22.3 percent here and 27.6 percent at the correlated high. Both sit inside the 20 to 33 percent band ATTOM cites, so the rehab line itself is not the outlier. The full cost stack is. Rehab plus holding plus both sides of closing is $111,928, or 34.4 percent of ARV, just past the top of that band. A top-down ratio will not tell you which line is wrong, but it will tell you when to stop trusting the bottom-up total.
Estimate Three Times and Keep All Three Columns
Most rehab sheets have one estimate column, which gets overwritten every time something changes. That is how a flipper ends up at day 40 knowing the budget is over without being able to say when it went over, or which decision did it.
Estimate at three gates and give each one a permanent column. Gate 1 is the walkthrough, before the offer. Gate 2 is after inspection and a written scope, which is the step that actually moves lines from Class 5 to Class 3. Gate 3 is bids in hand, which is Class 2. On Cedar Street, the inspection found a Federal Pacific Stab-Lok panel and galvanized supply lines, so the two Class 5 lines turned into real quotes.
| Line | Gate 1 walkthrough | Gate 2 post-inspection | Change |
|---|---|---|---|
| Roof | $13,200 (C2) | $13,200 (C2) | $0 |
| HVAC | $8,900 (C2) | $8,900 (C2) | $0 |
| Kitchen | $16,500 (C3) | $16,500 (C3) | $0 |
| Bathrooms | $11,000 (C3) | $11,000 (C3) | $0 |
| Flooring | $7,200 (C4) | $7,200 (C3) | $0 |
| Paint | $6,840 (C4) | $6,840 (C3) | $0 |
| Electrical | $5,200 (C5) | $9,400 (C2) | +$4,200 |
| Plumbing | $3,560 (C5) | $7,800 (C2) | +$4,240 |
| Base total | $72,400 | $80,840 | +$8,440 |
| High, correlated | $89,807 | $95,043 | +$5,236 |
| Ceiling | $72,472 | $72,252 | -$220 |
Two things are visible here that a single overwritten column hides. First, every dollar of the $8,440 increase came from the two lines the class column had already flagged as Class 5, which means the model worked and the warning was actionable at Gate 1. Second, the low end of the Gate 2 range is $70,679, so even the optimistic case now clears the ceiling by only $1,838. At Gate 1 the flipper still had an inspection contingency. At Gate 3 they do not.
Keep actuals in a separate flat table with a line column, a vendor column, a date column and a cost column, then pull them back with =SUMIFS(Actuals[Cost],Actuals[Line],$A5) and compute drift as =(K5-D5)/D5. Feed the same table from your draw requests so the money you asked the lender for and the money you booked against the line are the same number. The fix and flip draw request tracker covers that side of the plumbing.
Contingency Is a Distance, Not a Percentage
The standard advice is 10 percent for contingency, 20 percent if the house is old. On Cedar Street, 10 percent is $7,240. The sheet's own line items describe $17,407 of high side exposure. A flat 10 percent contingency therefore covers 42 percent of the risk your own estimate just documented, and the shortfall is invisible because the two numbers never appear in the same place.
Size contingency as a distance instead: =$D$16-$D$14, the correlated high minus the base. On this deal that is $17,407 at Gate 1. As lines move from Class 5 to Class 2 the number falls on its own, which is the correct behavior. Contingency should shrink because you learned something, not because you got further into the project.
The number also tells you what to do about it, which a percentage never does. At Gate 2 the rehab estimate rose $8,440. The instinct is to ask the seller for $8,440. Solve the ceiling backwards for purchase price instead, using Goal Seek to drive the cell =$B$20-$D$14 to zero by changing the purchase price, and the answer is $160,084. That is a reduction of $7,916, not $8,440. A smaller purchase price also shrinks the loan, the points, the interest and the buy side closing costs, and those give back $524. Roughly 94 cents of price reduction absorbs a dollar of new rehab. Ask for $8,440 and you are asking for more than the deal needs, which is how a negotiation you could have won turns into a seller who stops returning calls.
That contingency number is a cash requirement before it is an accounting entry, and it peaks in the middle of the job rather than at the end. Whether you can actually fund the bad case is a separate question from whether the deal survives it, and the fix and flip funding gap calculator is where that one gets answered.
What To Do Before You Sign
The discipline here is short, and it is entirely about refusing to let one number stand in for a range you already know exists.
- Put a class column on every line of the estimate and fill it honestly. If you did not open it, measure it, or get it priced, it is Class 5.
- Pull the low and high percentages from the AACE 56R-08 bands with
VLOOKUPrather than typing them, so the class is the only thing you can get wrong. - Roll up the high side with
=SUM(), not root sum of squares, for the go or no-go call. Rehab lines miss together. - Compute the maximum allowable rehab from ARV downward, with your profit floor in the stack rather than as a residual.
- Test the correlated high against the ceiling, never the base. A base estimate that clears by $72 is a coin flip wearing a green cell.
- Re-estimate at the walkthrough, after inspection, and after bids, and keep all three columns forever.
- Write the scope before you ask anyone for a price. It is the single cheapest move from Class 5 to Class 3, and the rehab scope of work template is the mechanism.
Cedar Street is not a story about a bad flipper. The walkthrough estimate was competent, the comps were real, and the ceiling math was correct. The deal failed because a $72 surplus was reported with the same confidence as a $40,000 one, and no cell on the sheet knew the difference.
If you would rather not wire the class table, the dual roll-up, the holding cost feedback loop and the gate columns together yourself, the Flip and BRRRR Calculator already carries them. The rehab block takes per-line classes and returns both high numbers, the maximum allowable rehab recalculates as the rehab and the purchase price move, and the gate columns are preserved side by side so the drift is visible while you can still act on it. Put Cedar Street through it and the KILL flag appears the same afternoon you walk the house, which is the only afternoon it is worth anything.
Related template
BRRRR Deal Calculator
Model the full Buy-Rehab-Rent-Refinance-Repeat cycle. See exactly how much capital comes back at refinance — before you commit a dollar.
Get the Template — $49