Self Storage Underwriting in Excel: Building a Model That Catches Bad Deals Before You Sign
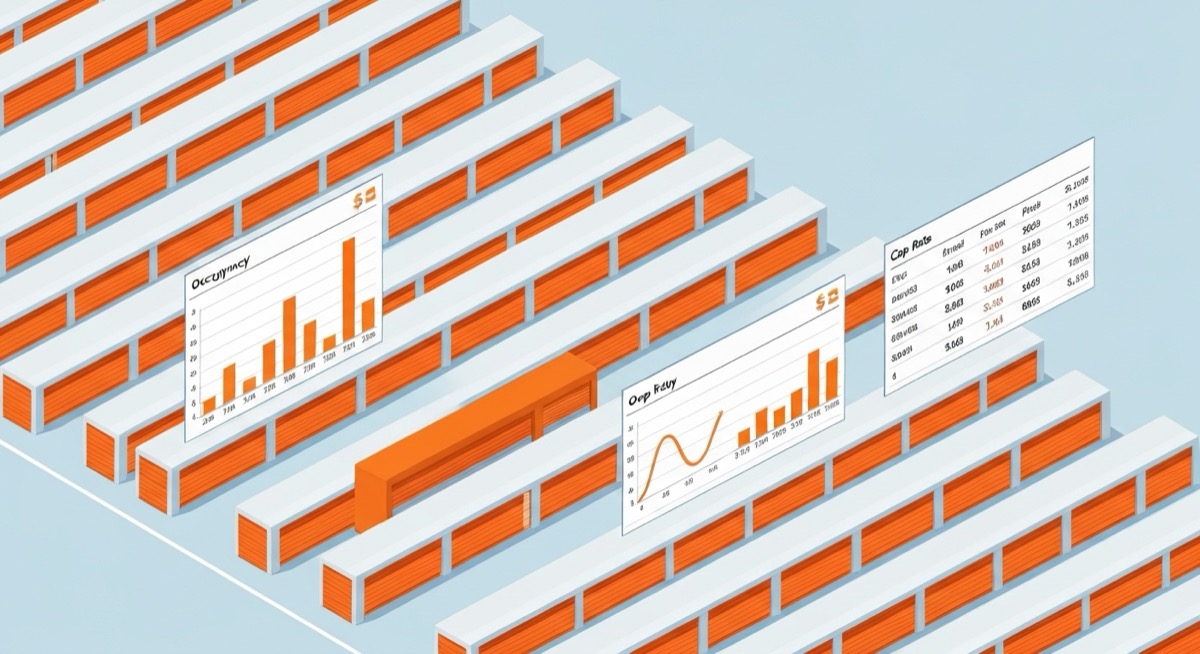
Self Storage Underwriting in Excel: Building a Model That Catches Bad Deals Before You Sign
A first-time self storage buyer pays $4.2M for a 320-unit facility in a tertiary market. The broker's offering memorandum claims 92 percent physical occupancy and $14.50 per square foot in street rates. Eighteen months in, his actual collected revenue runs 19 percent below the proforma. The cause: 92 percent occupancy was the all-time peak from two summers ago, the street rates were Saturday-morning quoted prices that nobody was actually paying, and the existing tenant base was locked into legacy rates 22 percent below the quoted street rate. He overpaid by $680,000 against any reasonable underwrite.
Self storage looks easy on the surface. Concrete boxes, low operating expenses, sticky tenants. The financial model that backs the purchase decision is where the discipline lives. A self storage underwriting Excel model that does not separate physical occupancy from economic occupancy, does not pull street rates from actual move-ins, and does not stress-test the rate roll, will mislead you on every deal you look at.
This article walks through how to build a self storage underwriting Excel model that survives contact with reality. It covers the revenue stack, the expense items most buyers underestimate, the cap rate math that brokers spin, and the sensitivity analysis that tells you when to walk.
Why Broker Proformas Lie About Self Storage
A broker's job is to sell the asset. The numbers in the offering memorandum reflect that incentive. Three specific distortions show up on almost every self storage deal:
Physical occupancy gets quoted instead of economic occupancy. A facility can show 90 percent of its units rented while collecting 75 percent of gross potential revenue. Free months, manager units, delinquencies, and rate concessions all create gaps. The Excel model needs both numbers.
Street rates get used as collected rates. The street rate is what a new tenant pays today for a unit listed on the website. The collected rate is what the existing tenant base actually pays after years of moderate increases that lag market. On a stabilized facility, collected rates often run 15 to 25 percent below current street rates. Underwriting at street rates assumes you can flip the entire tenant base overnight, which you cannot.
Expense ratios borrow from a different asset class. Brokers love to quote 30 to 35 percent expense ratios because that is the headline self storage number from REIT data. For a single-asset operator running a third-generation facility in a non-climate-controlled market, true expenses including management, insurance, property tax reassessment, and capex reserves often run 38 to 45 percent of effective gross income.
The model has to expose all three distortions and let you replace the broker's numbers with your own.
Building the Revenue Block: Occupancy and Street Rates
Lay out the revenue assumptions across rows 4 to 18. Use a column for each unit type because self storage facilities have heterogeneous unit mixes (5x5, 5x10, 10x10, 10x15, 10x20, 10x30, climate vs non-climate) and rates differ by 80 percent or more across them.
| Cell | Label | Example Value |
|---|---|---|
| B4 | Net rentable square feet | 42,500 |
| B5 | Total units | 320 |
| B6 | Trailing 12 month physical occupancy | 87% |
| B7 | Underwritten physical occupancy | 85% |
| B8 | Economic occupancy adjustment | 92% |
| B9 | Effective economic occupancy | =B7B8 (78.2%) |
| B10 | Average street rate per sq ft | $14.40 |
| B11 | Collected rate discount to street | 18% |
| B12 | Effective collected rate per sq ft | =B10(1-B11) ($11.81) |
| B13 | Gross potential rent | =B4B12 ($501,925) |
| B14 | Effective rental income | =B13B9 ($392,506) |
| B15 | Tenant insurance income | $24,000 |
| B16 | Late fees and admin | $11,500 |
| B17 | Other ancillary (boxes, locks) | $6,800 |
| B18 | Effective gross income | =SUM(B14:B17) ($434,806) |
The distinction between B7 and B9 is the entire game. The broker proforma will show physical occupancy, the bank wants to see economic occupancy, and your underwrite needs both because they tell different stories. A facility with 90 percent physical and 70 percent economic occupancy has an operations problem, not a demand problem, and that is fixable. A facility with 75 percent physical and 95 percent economic occupancy has a demand ceiling that you will not break through with cosmetic upgrades.
Pulling Real Street Rates From the Market
Do not trust the broker's street rate. Pull your own. The most reliable approach: open the facility's website in incognito mode, request a quote on three or four different unit sizes, and compare against the same unit sizes at the two nearest competitors. Repeat this on a Tuesday morning and a Saturday afternoon. The average across that sample is what a new tenant actually pays. Drop those numbers into a small reference table and feed them into B10 with a SUMPRODUCT weighted by unit mix:
=SUMPRODUCT(unit_count_range, street_rate_range)/SUM(unit_count_range)
This anchors the street rate to your market data, not the seller's data.
The Expense Stack Most Buyers Underestimate
Self storage runs lean compared to multifamily, but the line items that get missed cost real money. Lay out the expense block in rows 22 to 35.
| Cell | Expense Line | Per Sq Ft | Annual ($) |
|---|---|---|---|
| B22 | Property management (6% of EGI) | =B18*0.06/B4 | $26,088 |
| B23 | On-site labor | $0.85 | $36,125 |
| B24 | Property insurance | $0.42 | $17,850 |
| B25 | Property tax (post-reassessment) | $1.35 | $57,375 |
| B26 | Utilities | $0.38 | $16,150 |
| B27 | Repairs and maintenance | $0.30 | $12,750 |
| B28 | Marketing and PPC | $0.55 | $23,375 |
| B29 | Software and merchant fees | $0.18 | $7,650 |
| B30 | Office and admin | $0.12 | $5,100 |
| B31 | Capex reserves | $0.20 | $8,500 |
| B32 | Total operating expenses | =SUM(B22:B31) ($210,963) | |
| B33 | Expense ratio | =B32/B18 (48.5%) | |
| B34 | Net operating income | =B18-B32 ($223,843) | |
| B35 | NOI per sq ft | =B34/B4 ($5.27) |
Three line items deserve specific attention. Property tax reassessment is the silent killer. In most US markets, property tax resets to the new sale price after closing. If the seller bought the facility for $2.1M in 2018 and you buy at $4.2M, your tax bill roughly doubles even though nothing about the building changed. Pull the assessor's millage rate, multiply by your purchase price times the assessment ratio, and override the seller's tax line with your real number. Marketing is where amateur operators cheat their model. Storage facilities now compete on Google PPC, and a facility in a competitive submarket can spend $0.60 to $0.90 per square foot per year on customer acquisition. The seller who managed the facility passively was not spending this. You will. Capex reserves get omitted from broker proformas because brokers do not want to show the line. Asphalt resurfacing, roof replacement, gate motor replacement, and door cycle replacement add up to $0.20 to $0.35 per square foot per year on average across a hold period.
Cap Rate Math That Reflects Real Risk
The cap rate is the lever that brokers use to inflate price. A 10 basis point compression on a $4M facility moves the price by $200,000. Hold the cap rate honest in the model and you protect the basis.
The simple formula is straightforward: =B34/B40 where B40 is the purchase price. The discipline is in choosing what cap rate you actually need, not what the comps suggest.
| Market Tier | Stabilized Cap Range | Add for Lease-Up | Add for Tertiary |
|---|---|---|---|
| Top 25 MSA | 5.50% to 6.25% | +75 bps | n/a |
| Secondary MSA | 6.25% to 7.25% | +100 bps | +50 bps |
| Tertiary market | 7.50% to 9.00% | +125 bps | +75 bps |
| Rural / single facility | 9.00% to 11.00% | +150 bps | included |
A non-stabilized facility in a tertiary market should not be priced at the same cap rate as a stabilized REIT-quality property in Phoenix. If the broker is pitching you a 6.5 cap on a 78 percent occupied facility in a town of 22,000 people, the model should kick out a value-driven price using a 9.0 cap, then show the gap. =B34/0.09 versus =B34/0.065 on the same NOI gives you the negotiation range. On $223,843 NOI, that is $2.49M versus $3.44M. Almost a million dollars of disagreement, and the model tells you exactly where you stand.
Sensitivity Tables That Tell You When to Walk
Single-point underwriting is how you go broke. Build a sensitivity table that flexes the two variables that matter most, occupancy and rate, against the value driver, NOI and resulting price.
Use a two-variable data table in rows 45 to 55. Vertical axis: economic occupancy from 70 percent to 88 percent in 2 percent steps. Horizontal axis: collected rate per square foot from $10.50 to $13.50 in $0.50 steps. The cell formula references the NOI calculation, then divides by your target cap rate. Excel populates the grid through Data > What-If Analysis > Data Table.
| Occupancy \ Rate | $10.50 | $11.50 | $12.50 | $13.50 |
|---|---|---|---|---|
| 70% | $1.85M | $2.18M | $2.51M | $2.84M |
| 76% | $2.21M | $2.57M | $2.93M | $3.30M |
| 82% | $2.57M | $2.96M | $3.36M | $3.75M |
| 88% | $2.93M | $3.36M | $3.78M | $4.21M |
If the asking price is $4.2M and the table shows that you only hit that valuation at 88 percent occupancy and $13.50 per sq ft, both of which are top-of-market assumptions, the deal is priced for perfection. Build a flag in the model: =IF(B40>MAX(table_range),"OVERPRICED","WITHIN RANGE"). The flag does the deciding for you.
The Decision Checklist Before You Sign
Run these checks before submitting an offer. If any check fails, the model is not telling you the deal is good. The model is telling you where to push back.
- Physical occupancy and economic occupancy both shown, with a delta less than 5 percent (or explained variance documented)
- Street rates verified against three independent quote pulls, not broker numbers
- Collected rate discount to street rate set at 15 to 25 percent based on rate roll analysis
- Property tax line replaced with post-reassessment estimate using your purchase price
- Marketing and PPC line at minimum $0.40 per sq ft, more in competitive submarkets
- Capex reserve at $0.20 to $0.30 per sq ft minimum
- Cap rate selected from market-tier table with appropriate adjustments for lease-up and tertiary location
- Two-variable sensitivity table built showing NOI and resulting price across realistic occupancy and rate ranges
- Asking price compared against sensitivity grid: deal is priced inside the grid, not at the corner
From Underwriting Model to Acquisition Decision
The point of the model is not to produce a number. The point is to produce a defensible offer price and to know which assumptions break the deal. When the seller comes back with a counter $400,000 above your number, you can point at the cell that drives the gap. When your lender asks why you discounted street rates by 18 percent, you have the rate-pull data behind it. When the LP partner asks what happens if occupancy never rises above 80 percent, you flip to the sensitivity tab and show them.
Self storage is one of the few asset classes where a small operator can still beat institutional capital, because institutional capital cannot be bothered with a $4M facility in a tertiary market. The edge comes from disciplined underwriting that institutional teams cannot replicate at scale. A self storage underwriting Excel model is the tool that converts that discipline into a consistent acquisition process.
If you are running self storage underwriting alongside flips, BRRRR refinances, or other value-add real estate plays, the same discipline applies across asset types. The SheetCraft Flip and BRRRR Calculator handles the acquisition math for renovation-driven deals with the same rigor: real expenses, post-rehab valuation that reflects market reality, refinance scenarios that survive lender scrutiny, and sensitivity tables that flag deals priced for perfection. Stop underwriting on broker proformas. Build the model once, run every deal through it, and let the spreadsheet kill the bad ones for you.
Related template
BRRRR Deal Calculator
Model the full Buy-Rehab-Rent-Refinance-Repeat cycle. See exactly how much capital comes back at refinance — before you commit a dollar.
Get the Template — $49