Fix & Flip Analyzer
Know your projected profit before you make an offer. Not after you've committed.
Know your real profit after every cost — not the back-of-napkin version.
The Problem
Flipping houses looks simple on TV. Buy low, renovate, sell high.
In reality, the difference between a profitable flip and a money pit lives in the costs you didn't model. The holding costs that stack up during a 4-month rehab. The closing costs on both the buy and the sell side. The hard money interest payments. The contractor overruns in month three that somehow always happen.
A flip with a $40K "profit" on paper becomes a $12K profit — or a loss — when you account for 5 months of holding costs, 6% agent commissions, $4K in closing costs, and a $7K rehab overrun.
The flippers who consistently make money aren't luckier. They're more precise with their numbers before they buy.
The Solution
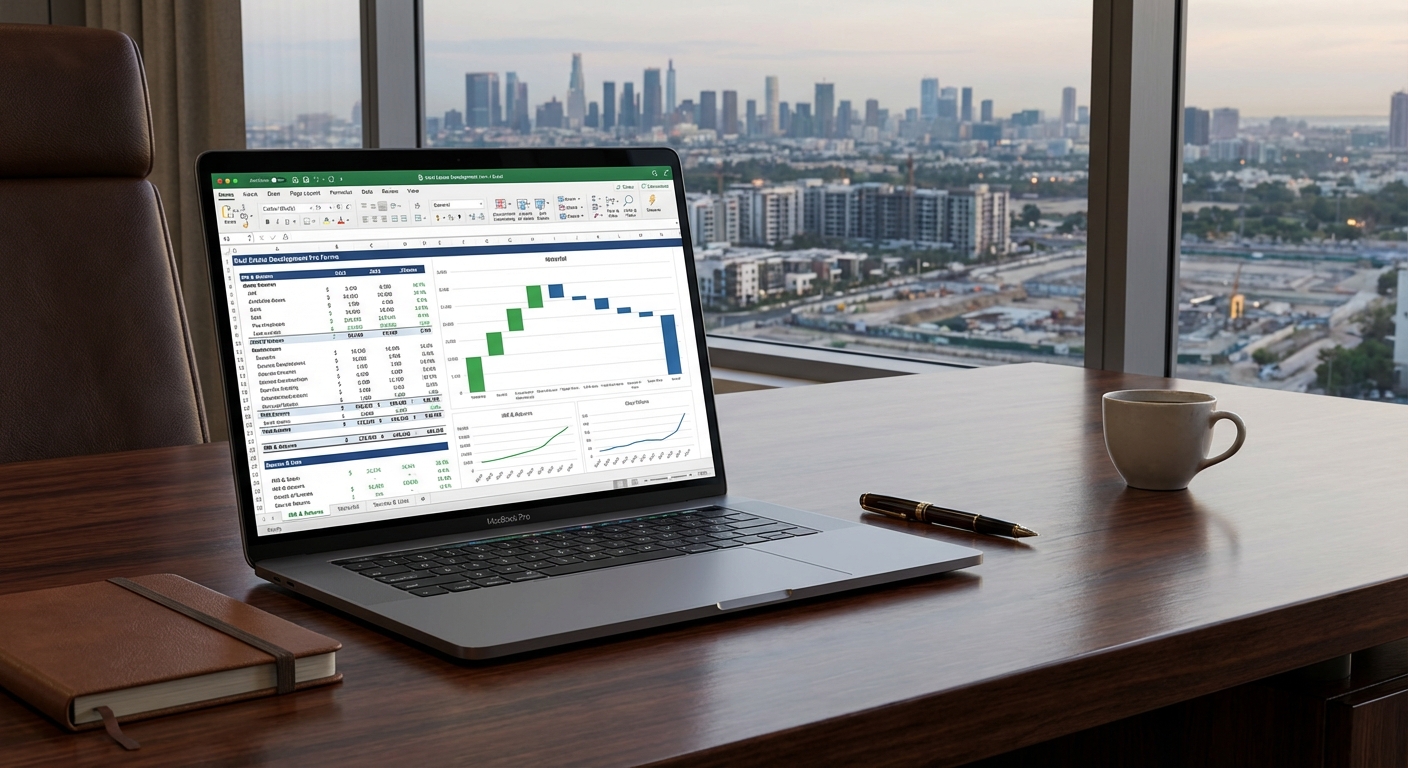
The Fix & Flip Analyzer models every cost from acquisition to sale so you know your projected profit before you make an offer.
Acquisition tab. Purchase price, closing costs, financing. Handles conventional, hard money, private money, and cash.
Rehab budget — 25+ construction categories. Not a single "Renovation Cost" field. Demo, framing, electrical, plumbing, HVAC, roofing, flooring, paint, kitchen, baths, landscaping, and more.
Holding costs tab. What the property costs every month you own it: loan payments, property taxes, insurance, utilities, HOA.
Sale projection. Enter your ARV, estimated days on market, and selling costs. The template calculates gross proceeds minus every dollar spent to show your true net profit.
Sensitivity analysis — the feature you won't find in free templates. How does your profit change if ARV comes in 5% or 10% lower? If rehab runs 10% or 20% over?
Features
- Acquisition modeling with support for hard money, private money, conventional, and cash
- Detailed rehab budget with 25+ construction categories
- Holding cost calculator (monthly burn rate during rehab and listing)
- Sale projection with ARV, agent fees, closing costs, and transfer taxes
- Net profit and ROI calculator (total and annualized)
- Sensitivity analysis: profit impact of ARV miss and rehab overruns
- Monthly cash flow timeline from purchase to sale
- Draw schedule tracker for hard money loan disbursements
- Comparable sales log to support your ARV estimate
- Print-ready deal summary for lenders and partners
Who is this for?
- Fix & flip investors evaluating deals before making offers
- First-time flippers who want a proven, structured framework
- Experienced flippers who are done with back-of-napkin math
- Hard money lenders reviewing deal packages from borrowers
- Wholesalers presenting professional deal analysis to flip buyers
Common questions about this template
“I already use a flip calculator app.”
Does it break rehab into 25+ categories or just use one field? Does it model holding costs month by month? Does it run sensitivity analysis showing what happens if ARV drops 10%? Most calculator apps give you a number. This template gives you the analysis behind the number.
“$49 is a lot for a spreadsheet.”
How much does a bad flip cost? Overestimate ARV by 8%. Underestimate rehab by $12K. Miss 3 months of holding costs at $2,200/month. That's $25,000+ in losses. This template costs $49 and forces you to model every scenario before you sign the contract.
Based on 35 reviews
Rated 4.8/5 based on 35 reviews
Verified customer reviews
Verified Purchase
“I've been flipping for 8 years and never had a proper spreadsheet. The Fix & Flip Analyzer forced me to account for holding costs I'd been ignoring. My last flip's actual profit was within 3% of what the template predicted.”
Jessica Torres
Real Estate Investor, Tampa, FL
Verified Purchase
“I bought the full bundle. I'm a one-man operation doing small remodels and buying rentals on the side. Having all the templates in one place, with the same look and feel — I stopped context-switching between five different spreadsheets.”
Chris Dolan
Contractor & Investor, Portland, OR
How does this compare?
You could build your own spreadsheet. You could use a free template. You could pay hundreds per month for software. Or you could be up and running in 5 minutes.
| Free Templates | Build Your Own | RE Software | SheetCraft | |
|---|---|---|---|---|
| Cost | $0 | $0 (+ your time) | $129+/month | $29–$49 one-time |
| Setup time | 2–3 hours fixing formulas | 20–40 hours | Weeks of onboarding | 5 minutes |
| 10-year projections | ||||
| Multi-deal comparison | ||||
| Works in Excel / Sheets | ||||
| Sensitivity analysis | ||||
| No subscription required |
Questions? Answered.
Yes. See how your profit changes if ARV drops 5-10% or rehab costs increase 10-20%.
Yes. It supports hard money, private money, conventional loans, and cash purchases.
Yes. Monthly holding costs including loan payments, taxes, insurance, and utilities are calculated automatically.
Stop guessing. Start knowing.
Get Instant Access — From $2930-day guarantee · Instant download · No subscription