Construction Draw Schedule Template: Your Lender Quoted $43,215. You Need $98,752.
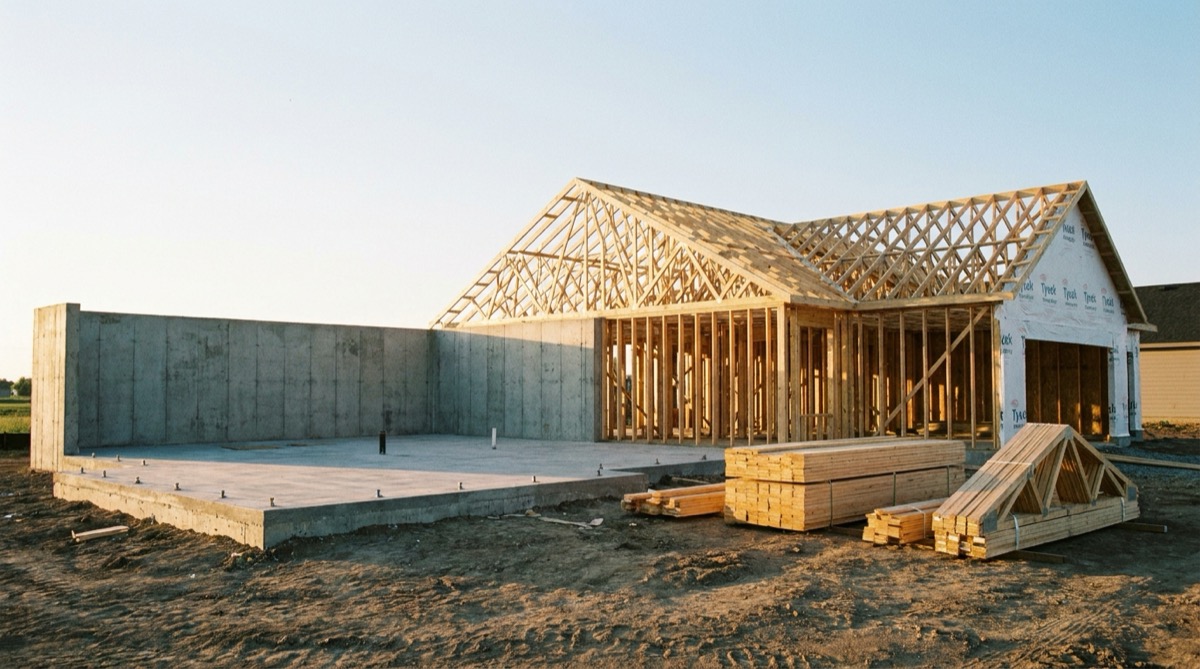
A construction draw schedule template is usually built to answer a scheduling question: which milestone releases which percentage of the loan. That is the easy half. The half that decides whether you finish the house is a cash question, and almost no draw schedule template answers it: on the worst week of the build, how much of your own money is sitting in the ground with nothing coming back for it?
Your lender already gave you a number for that, and the number is wrong. It is a subtraction. Take the budget, subtract the loan, call the difference your equity. On the build modeled below that subtraction says $43,215. The actual peak is $98,752, in week 22, and it gets there through three mechanics that never appear on the term sheet.
This article builds the model that produces that second number, using a real lender's published draw schedule and the industry's own published cost curve. Then it prices the three things you can negotiate, and shows which one the bank will actually approve.
The Equity Number on Your Term Sheet Is a Subtraction, Not a Cash Plan
Start with a build whose costs are not invented. NAHB's 2024 Cost of Construction Survey, the most recent in the series, reports an average construction cost of $428,215 for a home of 2,647 finished square feet, which is 64.4 percent of the $665,298 average sales price. The survey is small, 41 usable builder responses out of 4,000 questionnaires mailed, and NAHB says plainly that it is a percentage breakdown for a typical home rather than a representative average. For our purpose that caveat does not matter. What we need is the shape of the spend, and the survey publishes it in eight stages.
| Construction stage | Average cost | Share of construction cost |
|---|---|---|
| Site work (permits, impact fees, water and sewer, engineering) | $32,719 | 7.6% |
| Foundations | $44,748 | 10.5% |
| Framing (including trusses and sheathing) | $70,982 | 16.6% |
| Exterior finishes (wall finish, roofing, windows, doors) | $57,510 | 13.4% |
| Major systems rough-ins (plumbing, electrical, HVAC) | $82,319 | 19.2% |
| Interior finishes (insulation through fixtures) | $103,391 | 24.1% |
| Final steps (driveway, landscaping, clean up) | $27,710 | 6.5% |
| Other | $8,835 | 2.1% |
| Total construction cost | $428,215 | 100% |
Finance it the ordinary way. A construction loan of $385,000 against that $428,215 budget, lot owned free and clear and not part of the loan. The bank writes one line on the term sheet: borrower equity $43,215. Every builder reads that as the cash requirement. It is not. It is the closing balance of a cash account that spends the entire build underwater and only surfaces at the end.
One Real Lender's Draw Schedule, Against the Industry's Real Cost Curve
Space Coast Credit Union publishes its residential construction draw schedule as a one page PDF. It is worth using precisely because it is a real form a real borrower signs, not a blog's illustration. Seven releases, a closing draw plus six numbered draws, with a footnote that matters: 10 percent of the Loan in Process balance is held at the onset of the loan for the final draw. The holdback is carved out on day one, not skimmed from each draw.
The schedule is written for Florida slab construction, so it names masonry exterior walls, stucco and septic. The structure is the point, not the regional vocabulary. Map each of NAHB's 36 cost components, plus the stage NAHB labels simply "other," onto the milestone that releases it, and you can compare a real allocation against a real cost curve for the first time. One NAHB line has to be split, because the lender splits it: plumbing appears twice, once as under-slab rough plumbing in Draw 1 and once as rough-in in Draw 3. The split used here is 25 percent under slab, and it is a builder assumption, not survey data.
| Milestone | Percent of loan | Dollars released | Cost of the work it covers | Cost as percent of budget | Funding minus cost |
|---|---|---|---|---|---|
| Closing draw (permits, NOC, builder's risk) | 10% | $38,500 | $26,747 | 6.25% | +$11,753 |
| Draw 1 (site prep, footing, under-slab plumbing, slab) | 10% | $38,500 | $57,516 | 13.43% | -$19,016 |
| Draw 2 (exterior walls up, roof complete, interior framing) | 20% | $77,000 | $87,714 | 20.48% | -$10,714 |
| Draw 3 (windows, doors, all rough-ins, stucco) | 20% | $77,000 | $116,301 | 27.16% | -$39,301 |
| Draw 4 (drywall, paint, trim, cabinets, flooring) | 20% | $77,000 | $72,476 | 16.93% | +$4,524 |
| Draw 5 (insulation, lighting, fixtures, driveway, landscape) | 10% | $38,500 | $39,210 | 9.16% | -$710 |
| Draw 6, final (CO, survey, appliances, other) | 10% | $38,500 | $28,251 | 6.60% | +$10,249 |
| Total | 100% | $385,000 | $428,215 | 100% | -$43,215 |
The total gap is the equity, as it must be. The interesting column is the one above it. Four of the seven milestones release less money than the work they cover costs: Draws 1, 2, 3 and 5. The three that release more are the closing draw, Draw 4 and the final draw, and two of those three sit at the very start and the very end of the job, which is exactly backwards from where a builder needs the cushion.
Draw 3 Is Where the Money Dies
Line up the worst row. Draw 3 covers windows and exterior doors, the plumbing rough-in, the electrical rough-in, HVAC, and the stucco or siding. In NAHB dollars that bundle is $116,301, or 27.16 percent of the entire construction budget. The lender releases 20 percent, which is $77,000. You carry $39,301 of that milestone yourself until the money for a later milestone arrives.
That is not a rounding error and it is not unique to this credit union. It happens because every round-number draw schedule assumes the rough-in phase is about a fifth of a house, and it is not. Plumbing, electrical and HVAC alone are 19.2 percent of construction cost in the NAHB data, before a single window or a square foot of stucco is added to the same milestone.
Run the cumulative position at each milestone, assuming for a moment that money arrives the instant the inspector signs:
| At the moment this draw funds | Cost incurred to date | Loan funded to date | Your money in the job |
|---|---|---|---|
| Closing draw | $26,747 | $38,500 | -$11,753 |
| Draw 1 | $84,263 | $77,000 | $7,263 |
| Draw 2 | $171,977 | $154,000 | $17,977 |
| Draw 3 | $288,278 | $231,000 | $57,278 |
| Draw 4 | $360,754 | $308,000 | $52,754 |
| Draw 5 | $399,964 | $346,500 | $53,464 |
| Draw 6, final | $428,215 | $385,000 | $43,215 |
Peak $57,278, which is 1.33 times the equity the term sheet quoted, and this is the optimistic version. Nobody funds a draw the instant the inspector signs.
Building the Draw Schedule Model in Excel
Four blocks. The whole thing fits on one sheet and takes about forty minutes to wire.
Block 1, inputs, in C4 to C10. Loan amount in C4, construction budget in C5, construction loan rate in C6, draw funding lag in weeks in C7, subcontractor payment terms in weeks in C8, final holdback percent in C9, and your own cost of capital in C10. That last cell is the one nobody puts on a draw schedule and it decides the most important question in this article.
Block 2, cost lines, A14 down. One row per budget line. Column A the line item, column B the dollars, column C the week the work starts, column D the week it finishes, column E the lender milestone that releases it. Column E is the whole trick. It is not the phase the work belongs to, it is the milestone the loan agreement ties it to, and those are different for more lines than you expect.
Block 3, the milestone table, H4 to N10. One row per draw:
- Column H: milestone name, spelled exactly as it appears in column E
- Column I: the lender's percentage
- Column J:
=$C$4*I4, dollars released - Column K:
=SUMIF($E$14:$E$60,$H4,$B$14:$B$60), the cost the milestone actually covers - Column L:
=J4-K4, the gap, and the column that found Draw 3 - Column M:
=MAXIFS($D$14:$D$60,$E$14:$E$60,$H4), the week the milestone is achieved, which is the week its last component finishes - Column N:
=M4+IF(M4=0,0,$C$7), the week the wire actually lands
Block 4, the weekly grid, A55 down, week 0 through week 30. This is where the percentages turn into cash.
- Column B, cost incurred that week:
=SUMPRODUCT(($C$14:$C$60<=$A55)*($D$14:$D$60>=$A55)*($B$14:$B$60/($D$14:$D$60-$C$14:$C$60+1))). Each line spreads evenly across the weeks it runs. - Column C, cash actually leaving your account:
=IFERROR(INDEX($B$55:$B$85,MATCH($A55-$C$8,$A$55:$A$85,0)),0). Work performed, then paidC8weeks later. - Column D, draw funded that week:
=SUMIF($N$4:$N$10,$A55,$J$4:$J$10) - Column E:
=E54+C55, cumulative cash paid - Column F:
=F54+D55, cumulative loan funded - Column G:
=E55-F55, your money in the job this week - Column H:
=F55-E55, the mirror, used only for the lender exposure flag
Four outputs sit under the grid and they are the only four numbers you should ever quote:
- Peak out of pocket:
=MAX($G$55:$G$85) - The week it happens:
=INDEX($A$55:$A$85,MATCH(MAX($G$55:$G$85),$G$55:$G$85,0)) - Construction loan interest:
=SUMPRODUCT(($A$55:$A$85<=MAX($N$4:$N$10))*$F$55:$F$85)*$C$6/52, accruing weekly on the drawn balance until the final draw funds and the loan converts - Lender exposure flag:
=IF(MAX($H$55:$H$85)>0,"BANK AHEAD OF THE WORK","OK"). You will need this in a minute.
Two parameters now decide everything, and neither is in the draw schedule. The funding lag C7 is inspection plus review plus wire, call it two weeks. The payment terms C8 are what your subs and suppliers actually let you do, call it four weeks for net 30 on a weekly grid. Set the rate in C6 to 8.00 percent, which is the bank prime loan rate of 7.00 percent as published in the Federal Reserve H.15 release of September 21, 2026, effective September 17, plus a 100 basis point construction spread. Prime moved up 25 basis points that week, so every week of drawn balance now costs more than it did in early September.
The Seven Week Dry Spell Between Draw 3 and Draw 4
With the lag and the payment terms switched on, the peak moves from $57,278 to $98,752, in week 22 of a 24 week build. That is 2.29 times the $43,215 the term sheet called your equity.
The reason is visible the moment you list the weeks money actually arrives. Milestones are achieved in weeks 0, 4, 10, 14, 21, 23 and 24. Add the two week lag and the wires land in weeks 0, 6, 12, 16, 23, 25 and 26. Look at the interval between the fourth and fifth wire.
| Between these two wires | Weeks with no funding | Cash paid out during them |
|---|---|---|
| Week 0 to week 6 | 6 | $30,101 |
| Week 6 to week 12 | 6 | $86,786 |
| Week 12 to week 16 | 4 | $81,673 |
| Week 16 to week 23 | 7 | $68,543 |
| Week 23 to week 25 | 2 | $17,590 |
Seven weeks, $68,543 out, nothing in. On four week terms that cash covers the work performed in weeks 13 through 18: the tail of the electrical and HVAC rough-ins ($18,107), the last of the stucco ($12,225), the insulation ($6,992), all of the drywall ($13,962), the first weeks of paint and interior trim ($13,893), and $3,364 of small lines NAHB books as "other." You fund every dollar of it, because Draw 4 cannot even be requested until the flooring goes down in week 21, and then takes two more weeks to land. The dry spell is not caused by any single percentage being wrong. It is caused by the milestones being spaced unevenly in time while the spend is not.
Your payment terms are the other half of that sentence, and they are worth more than most people think. If the concrete crew and the framer will not wait and you pay on completion instead of at four weeks, the same loan, the same schedule and the same build produce a peak of $180,260, which is 4.17 times the quoted equity. The subcontract you sign is a financing document. If you have not modeled it that way, the pay when paid cash flow tracker and the cash conversion cycle calculator are the two places that timing becomes visible.
The Line Item You Install in Week 14 and Get Paid For in Week 25
Read the Space Coast schedule one more time, slowly. Insulation is listed in Draw 5, alongside the driveway, the soffits and the landscaping. Drywall is in Draw 4.
Insulation goes in behind drywall. It is physically impossible to install it after. In the model it is performed in week 14, the week before the drywall starts, and it is funded in week 25, two weeks after the drywall money arrives. NAHB puts insulation at $6,992. You pay for it in week 18 under net 30 terms and you are reimbursed in week 25, a wait of 11 weeks from the work, against 6 weeks for the drywall that covers it.
| Milestone | Wire lands in week | Cost in the bucket | Average wait from work to funding |
|---|---|---|---|
| Draw 1 | 6 | $57,516 | 3.13 weeks |
| Draw 2 | 12 | $87,714 | 4.73 weeks |
| Draw 3 | 16 | $116,301 | 4.33 weeks |
| Draw 4 | 23 | $72,476 | 4.37 weeks |
| Draw 5 | 25 | $39,210 | 4.65 weeks |
| Draw 6, final | 26 | $28,251 | 6.69 weeks |
Compare each wait against your payment terms of four weeks. Draw 1 funds faster than you pay, which is why the early weeks of the model run negative. Every other bucket funds slower. Draw 6 is the worst at 6.69 weeks, and the reason is the $8,835 NAHB books as "other," which this model spreads across all 24 weeks of the build because that is how general conditions behave, and which the lender releases in a single wire at the very end. Long lead deposits behave the same way, paid at order and funded at installation, which is why a long lead item tracker belongs next to this model rather than inside your schedule software.
Fixing the insulation line is a two sentence email to your loan officer before closing: move insulation from Draw 5 to Draw 4. It is $6,992 and it will probably be granted without a second thought, which is the point. The items that move easily are the ones nobody asks about.
Three Levers, Priced, and the One the Bank Will Say Yes To
You can negotiate the allocation, you can negotiate the funding lag, and you can negotiate your subcontract terms. Here is what each is worth against the $98,752 baseline.
| Change | Peak out of pocket | Reduction | Multiple of quoted equity |
|---|---|---|---|
| Baseline: published schedule, 2 week lag, 4 week terms | $98,752 | - | 2.29x |
| A. Allocation matched to the cost curve | $80,837 | $17,914 | 1.87x |
| B. Funding lag cut from 2 weeks to 1 | $88,207 | $10,545 | 2.04x |
| C. Subcontract terms from 4 weeks to 6 | $79,468 | $19,284 | 1.84x |
| All three together | $55,703 | $43,049 | 1.29x |
The largest single lever is not in the loan documents. It is lever C, your own subcontract payment terms, and it is worth $19,284, more than renegotiating the draw percentages. Builders spend their leverage arguing with the bank and then sign subcontracts that hand it all back.
Lever A is the interesting one, because of what it costs. "Cost matched" means each milestone releases the same share of the loan that it consumes of the budget, with the lender's 10 percent final holdback left untouched.
| Milestone | Published | Cost matched | Dollars moved |
|---|---|---|---|
| Closing draw | 10.00% | 6.02% | -$15,328 |
| Draw 1 | 10.00% | 12.94% | +$11,328 |
| Draw 2 | 20.00% | 19.74% | -$1,011 |
| Draw 3 | 20.00% | 26.17% | +$23,755 |
| Draw 4 | 20.00% | 16.31% | -$14,212 |
| Draw 5 | 10.00% | 8.82% | -$4,531 |
| Draw 6, final | 10.00% | 10.00% | $0 |
Money moves in both directions, which is why the average drawn balance barely changes. Total construction loan interest over the build goes from $6,574.62 to $6,581.15. Six dollars and fifty three cents. That is the entire price, to either party, of a change that takes $17,914 off your peak cash requirement.
And the bank is never exposed. Under the cost matched allocation the loan is still behind the work in place at every single milestone: $3,575 behind at closing, $11,264 at Draw 1, $22,989 at Draw 2, $38,535 at Draw 3, $48,223 at Draw 4. That is the sentence to put in the email, because "you are still $38,535 behind the value in place at rough-in" is the only argument a credit officer is required to care about.
Now contrast the ask most builders actually make. Front load the schedule properly: 15 percent at closing, 15 at Draw 1, 25 at Draw 2, 25 at Draw 3, then 10, 5 and 5. It works beautifully for you. Peak out of pocket falls to $43,215, which means the term sheet's equity number finally becomes true. It also costs $1,866 in extra interest, and it puts the lender ahead of the work in place by $31,003 at closing, $31,237 at Draw 1, $39,773 at Draw 2 and $19,722 at Draw 3. No credit committee approves that, and none should. Ask for it and you have spent your goodwill on the one version of the change that cannot be granted.
There is a clean rule underneath the interest arithmetic. Front loading moves 1,212,750 dollar-weeks of exposure off your balance sheet and onto the loan. Exactly that many, in both directions, because the total cost and the total loan are fixed. So the extra interest at 8.00 percent is $1,866 and the relief is the same 1,212,750 dollar-weeks valued at your cost of capital. If your cash costs 12 percent, the relief is $2,799 and you are ahead by $933. If it is idle in a business savings account earning 5.50 percent, the relief is $1,283 and front loading costs you $583 net. Front loading pays if and only if your marginal dollar costs more than your construction loan rate. Put that comparison in C10 against C6 and let the sheet answer: =IF($C$10>$C$6,"FRONT-LOAD","TAKE THE MONEY LATE").
Price the Draw Schedule Before You Sign It, Not After
The order of operations is fixed, because the leverage disappears at closing.
- Map every budget line to the milestone that funds it, before you sign. Column E of the model is the deliverable, and it will find two or three lines like insulation that are funded out of sequence with the build.
- Compute the gap column. Any milestone where the release is more than five points below the cost share is a milestone you are financing. On this build the rule flags exactly one, Draw 3, at 7.16 points. Bring that row to the lender, not a complaint.
- Ask for cost matching, never for front loading. Lead with the number that protects the lender: the loan stays behind the work in place at every milestone, and the interest changes by single digits.
- Get the funding lag in writing. Two weeks versus one week is $10,545 on this build, and it costs the bank nothing to commit to an inspection turnaround.
- Negotiate your subcontracts with the draw calendar in front of you. It is the biggest lever on the list and the only one you control unilaterally. Retainage you hold from subs works the same way, which the retainage tracking spreadsheet handles line by line.
- Carry peak out of pocket, not equity, in your construction budget. On this build that is $98,752 against a quoted $43,215, and the difference is the number that decides whether week 22 is survivable.
None of this is an argument that the lender's schedule is unfair. It is an argument that the schedule answers a question about collateral and you need the answer to a different question about cash, and the two have never been the same document. The bank's percentages protect the bank's position. Nothing in them is designed to tell you what week 22 looks like.
If you would rather not start from a blank sheet, the Construction Budget Tracker carries the layer underneath this model: budget against actual cost by line with automatic variance, a change order log whose impact runs through the whole budget, a cash flow projection driven by the payment schedule, a payment tracker by vendor, status and date, and print-ready summary sheets for the lender. The milestone mapping, the weekly grid, the payables shift and the lender exposure flag from this article are yours to add on top of it. Build them before the term sheet is signed, and the conversation with your loan officer becomes a two column table instead of an argument.
Related template
Construction Budget Tracker
Track every line item, change order, and payment across your entire project. Spot a $23K billing discrepancy before it hits your bottom line — not after.
Get the Template — $49