Your Rental Property Analysis Spreadsheet Is Missing Breakeven Occupancy
A rental property analysis spreadsheet is supposed to answer one question: should I buy this. Most of them answer a different question instead, and they answer it with a confidence that has nothing behind it.
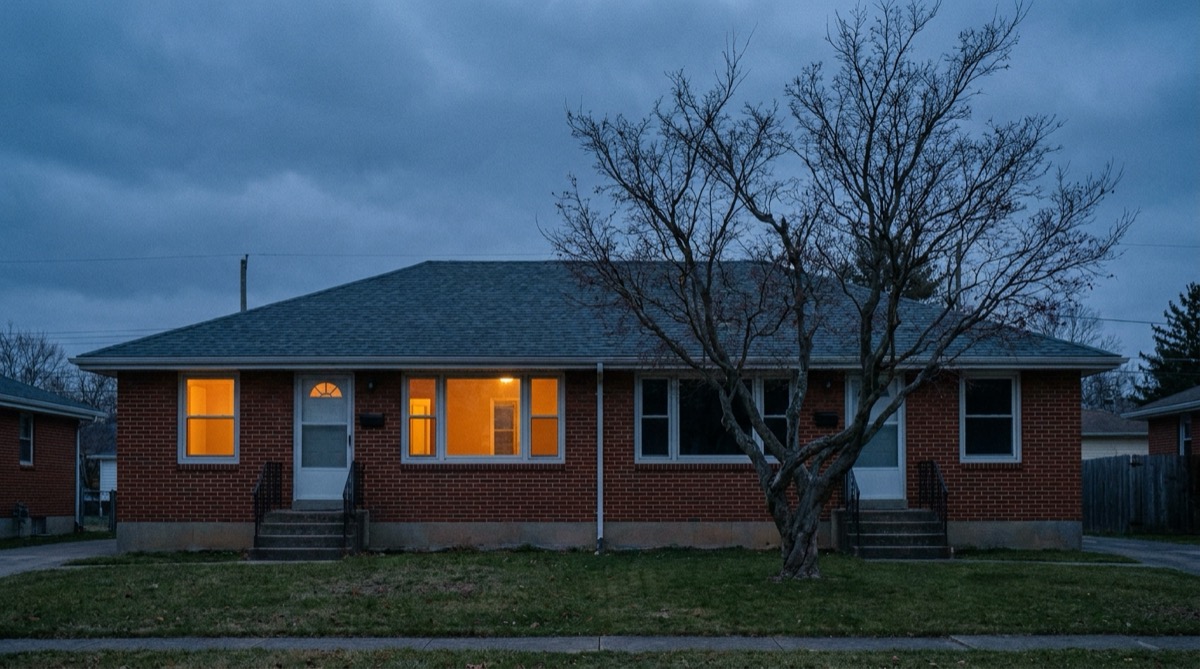
Here is a real shape of deal for September 2026. A 1958 duplex, both sides rented, asking $248,000. Gross rent is $2,700 a month. You put 25 percent down, borrow $186,000 at 7.50 percent on a thirty year note, and spend $6,200 on closing and $8,500 getting both units ready. Total cash out of pocket: $76,700.
Run that through a standard analysis spreadsheet and it returns a 6.56 percent cash-on-cash return, $419.26 a month, an 8.32 percent cap rate. Rebuild the same deal with the actual dollar amounts, and it loses $85.91 a month. Nothing about the property changed. Only the way the expenses were written down changed.
The $6,062 that lives between two spreadsheets
The standard template models operating costs as percentages of rent. Five percent vacancy, eight percent management, five percent maintenance, five percent capital reserve, and then two lines the investor types in by hand: property taxes copied off the listing and an insurance number the agent guessed at.
| Line | Percentage model | Actual quoted dollars | Difference |
|---|---|---|---|
| Property taxes | $2,880 | $4,712 | $1,832 |
| Insurance | $1,560 | $2,340 | $780 |
| Maintenance and capital reserve | $3,240 | $4,400 | $1,160 |
| Lawn and snow contract | $0 | $1,140 | $1,140 |
| Turnover and leasing | $0 | $1,150 | $1,150 |
| Management at 8 percent | $2,462.40 | $2,462.40 | $0 |
| Annual cash flow | $5,031.13 | -$1,030.87 | $6,062.00 |
Read the management row before anything else. It is identical in both columns, to the cent. That is the whole finding. The one expense that genuinely is a percentage of rent is the one line the percentage model gets exactly right, and every dollar of the $6,062 gap sits in lines that are not percentages of anything.
Two of those lines are worth more than the tax error everyone argues about. Lawn and snow plus turnover and leasing come to $2,290. The property tax mistake, the one that gets caught on forums every day, is $1,832. The percentage template did not get those two lines wrong. It had no row for them at all, because there is no percentage of rent that describes a snow contract.
That is the failure mode worth internalizing. A percentage model does not fail by being badly calibrated. It fails by omission, and you cannot tune your way out of an omission. Changing five percent maintenance to seven percent does not create a line for the lawn.
You cannot write a fixed cost as a percentage of a variable one
This is arithmetic, not opinion. If every expense is a fraction of rent, then cash flow is rent multiplied by a constant, minus debt service. Change the rent and the whole expense stack slides with it. The county does not slide with it. Your insurer does not slide with it.
Watch what that does to the two deals below. They differ only in fixed costs, by $6,230 a year. At 95 percent occupancy their cash flows differ by $6,230. At 90.5 percent occupancy their cash flows differ by $6,230. The spread never moves, because fixed costs shift the line down without changing its slope.
A percentage can only ever change the slope. There is no number you can type into a percentage field that produces a parallel shift. The template is not missing a value. It is missing a shape, and that is why the 50 percent rule screen can be tuned to the right average and still be wrong about the specific building in front of you.
Sort every line by one question
Go through your expense rows and ask: does this stop when the unit is empty? That single question splits the sheet, and almost everything lands on the same side.
| Expense | Stops when vacant? | Classification |
|---|---|---|
| Property taxes | No | Fixed |
| Insurance | No, and vacancy often raises it | Fixed |
| Lawn, snow, pest | No | Fixed |
| Maintenance | No, systems age on a calendar | Fixed |
| Capital reserve | No | Fixed |
| Turnover and leasing | No, it rises as occupancy falls | Fixed or worse |
| Debt service | No | Fixed |
| Management fee | Yes, charged on collected rent | Variable |
One line out of eight is variable. That is the honest structure of a long term rental, and it is why the percentage habit is so expensive here. If you want a complete row list before you sort, work from a full rental property expense category list rather than whatever your template shipped with.
Turnover deserves the footnote. It does not merely fail to shrink when the unit sits empty, it grows, because an empty unit is what generates a leasing fee and a make-ready. Treating it as fixed is already generous. The real curve is worse than the straight line below.
Breakeven occupancy, and the formulas that produce it
Once the lines are sorted, the number you actually need falls out in one formula. Breakeven occupancy is the share of the year the property must be rented before it stops consuming your money.
Lay the inputs out like this. Purchase price in B3, down payment percentage in B4, loan in B5 as =B3*(1-B4), rate in B6, term in months in B7, and monthly principal and interest in B8 as =-PMT(B6/12,B7,B5). Monthly gross rent in B9, annual gross potential rent in B10 as =B9*12, and total cash invested in B11.
Put your six fixed dollar amounts in C14:C19 and total them in C20 with =SUM(C14:C19). Put the management rate in C22. Then four rows do the work:
| Cell | Formula | What it tells you |
|---|---|---|
| B26 | =B10*B25 | Rent actually collected at the occupancy in B25 |
| B28 | =B26-C20-B26*C22-B8*12 | Annual cash flow after every fixed line and debt |
| B31 | =(C20+B8*12)/(B10*(1-C22)) | Breakeven occupancy |
| B32 | =(1-B31)*365 | Vacant days per year you can absorb |
The denominator is the part people get wrong. It is gross potential rent times one minus the management rate, not gross rent, because the manager takes a cut of every marginal dollar you collect. Divide by gross rent instead and this deal reports a breakeven of 90.58 percent, understating it by 7.88 points and turning a property that needs near perfect occupancy into one that appears to absorb 34 vacant days a year.
Add the flag that makes the sheet argue with you: =IF(B31>0.927,"FLAG: needs better than market occupancy","OK"). The 0.927 is not arbitrary, and the next section explains where it comes from.
On the duplex, B31 returns 98.46 percent and B32 returns 5.6 days. The deal tolerates five and a half vacant days a year. A single ordinary 45 day turn costs $3,994.52 in rent, $3,674.96 after the management fee you do not pay on it, against that 5.6 day cushion.
Same price, same rent, 21 points apart
Now the comparison that a percentage spreadsheet physically cannot make. Two properties, both $248,000, both renting for $2,700 a month, both financed identically. Every input a percentage model consumes is the same for both, so it returns the same answer for both. It has nothing to distinguish them with.
| Deal A: 1958 duplex | Deal B: 2015 single family | |
|---|---|---|
| Property taxes | $4,712 | $2,852 |
| Insurance | $2,340 | $1,680 |
| Lawn and snow | $1,140 | $0, tenant handles it |
| Maintenance | $2,400 | $900 |
| Capital reserve | $2,000 | $1,100 |
| Turnover and leasing | $1,150 | $980 |
| Total fixed | $13,742 | $7,512 |
| Cash flow at 95 percent | -$1,030.87 | $5,199.13 |
| Cash-on-cash at 95 percent | -1.34 percent | 6.78 percent |
| Breakeven occupancy | 98.46 percent | 77.56 percent |
| Vacant days absorbed | 5.6 | 81.9 |
Twenty-one points of breakeven separate them. In days, it is 5.6 against 81.9, a difference of 76 days a year. Deal B absorbs a 45 day turn with 36.9 days still to spare. Deal A does not survive one tenant giving notice.
Both deals would print the same cash-on-cash figure in a template driven by percentages, because the only inputs that differ are the ones a percentage model does not have fields for. If you report cash-on-cash return without reporting breakeven occupancy beside it, you are describing the deal on its best day and staying quiet about its ordinary ones.
The vacancy rate in your template is not the vacancy rate in your market
Almost every rental analysis spreadsheet ships with a five percent vacancy default, which implies 95 percent occupancy. The Census Bureau measures the real thing. In its Housing Vacancies and Homeownership release for the second quarter of 2026, the national rental vacancy rate was 7.3 percent, which is 92.7 percent occupancy.
| Market | Rental vacancy, Q2 2026 | Implied occupancy | Deal A shortfall |
|---|---|---|---|
| Template default | 5.0 percent | 95.0 percent | 3.46 points |
| United States | 7.3 percent | 92.7 percent | 5.76 points |
| South | 9.5 percent | 90.5 percent | 7.96 points |
| Midwest | 6.9 percent | 93.1 percent | 5.36 points |
| Northeast | 5.9 percent | 94.1 percent | 4.36 points |
| West | 5.3 percent | 94.7 percent | 3.76 points |
Deal A needs 98.46 percent occupancy. There is no region of the United States whose average rental occupancy reaches that, including the tightest one. The deal requires you to beat the best regional market in the country by 3.76 points, every year, forever.
Notice the trap inside the template's own defaults. Feed the spreadsheet's own five percent vacancy assumption into the real expense dollars and the duplex already loses $1,030.87 a year. The percentage model hid that from itself, because when it deducted five percent of rent for vacancy it also quietly shrank every expense by five percent. It applied the vacancy to both sides of the ledger. Reality applies it to one.
A quarter point of rate is worth more than the roof
Run the rate through the same formula and the ranking of what matters changes completely.
| Rate | Monthly P and I | Breakeven occupancy | Vacant days absorbed |
|---|---|---|---|
| 6.76 percent | $1,207.63 | 94.72 percent | 19.3 |
| 7.50 percent | $1,300.54 | 98.46 percent | 5.6 |
| 7.75 percent | $1,332.53 | 99.75 percent | 0.9 |
| 8.00 percent | $1,364.80 | 101.05 percent | none |
At 8.00 percent the breakeven occupancy is 101.05 percent. That is not a hard deal. It is an impossible one. The property cannot break even at any occupancy, because full occupancy is not enough. Between 7.75 and 8.00 percent, a quarter of a point moves the deal from needing near perfection to needing something that does not exist.
The 6.76 percent row is the one to be careful with. That was the Freddie Mac Primary Mortgage Market Survey average on September 10, 2026, and Freddie Mac defines that survey as conventional, conforming, fully amortizing purchase loans for borrowers putting 20 percent down with excellent credit. That is an owner occupant. It is not the rate on a 25 percent down investment property, and typing the number you saw in a headline into your analysis sheet is worth 3.74 points of breakeven occupancy on this deal, which is the difference between a loss and a small gain.
What to verify before the earnest money goes hard
Three inputs carry most of the error, and all three are verifiable in under an hour.
- The tax bill after your purchase, not the seller's. Many jurisdictions reassess on transfer, and owner occupant caps and exemptions do not travel with the deed. Call the assessor with the sale price and ask what the bill becomes. On this deal that single call is worth $1,832 a year.
- A bound insurance quote, not an estimate. Give a broker the year built, roof age, and the fact that it is a non owner occupied rental. The ballpark was $1,560 and the quote was $2,340.
- The lines with no percentage. Snow, lawn, pest, landlord paid water and sewer, trash, leasing fees, turn costs. They have no row in a percentage template and they came to $2,290 here, more than the tax error.
Then run the two numbers that decide it. Breakeven occupancy against your market's actual occupancy, and vacant days absorbed against how long your last unit took to lease. If breakeven sits above the regional occupancy, the deal is not thin, it is structurally short, and the fix is arithmetic rather than optimism: this duplex clears the national 92.7 percent only at $2,867.72 in rent, a 6.2 percent increase, or at a purchase price of $227,050, which is $20,950 below ask.
That second number is the useful one, because price is the only variable in the list you control. Breakeven occupancy is not a reason to walk away from a property. It is a reason to know exactly what to offer for it, and it converts an argument about whether a deal feels tight into a specific dollar figure you can put in a contract. Note that this is a different question from when your total cash investment gets paid back, which asks about years rather than about whether the property can carry itself at all.
The SheetCraft Rental Property Analyzer is built on the fixed and variable split rather than on percentages of rent. The expense rows are already sorted by whether they stop when the unit is empty, breakeven occupancy and vacant days absorbed calculate on every deal instead of being something you remember to add, and the occupancy flag is wired to regional vacancy rather than to a five percent default that no region actually achieves. You enter the assessor's number and the bound quote, and the sheet tells you the maximum price at which the property carries itself. That is the number you needed before you wrote the offer.
Related template
Rental Property Analyzer
Analyze any rental deal in 15 minutes — not 3 hours in a messy spreadsheet. Cash flow, cap rate, cash-on-cash return, and 10-year projections. All automated.
Get the Template — $49